Global Talent
 Cultural Global
EY releases "Overview of China's Outbound Investment in the First Three Quarters of 2026": the pace of outbound investment slows down, and overseas c


*This article is from the official account: EY
WeChat ID: EY_GreaterChina
First three quarters of 2026:
Outward Foreign Direct Investment 1: China's total outward foreign direct investment across all industries reached USD 128.6 billion, down 0.2% year on year; non-financial outward foreign direct investment fell 8.8% year on year, marking four consecutive quarters of year-on-year decline; financial outward foreign direct investment rose 52% year on year.
Overseas M&A 2: The total value of overseas M&A announced by Chinese enterprises reached USD 25.1 billion, down 14% year on year. Among them, the M&A value in the third quarter dropped sharply by 36% quarter on quarter; the number of transactions stood at 262, down 15% year on year, indicating further reduced transaction activity.
By industry: Mining and metals was the most popular sector, with both M&A value and transaction volume growing against the trend. Its M&A value hit USD 6.89 billion, up 94% year on year; the M&A value of the advanced manufacturing and transportation sector reached USD 4.97 billion, up 128% year on year, ranking first in transaction volume.
By region: Asia remains the largest destination, with M&A value of USD 7 billion and 111 transactions, accounting for 42% of the total and taking the lead in M&A activity; Oceania jumped to the second largest destination, with M&A value of USD 6.6 billion, surging 263% year on year, hitting a nine-year high; Europe ranks the third, with M&A value of USD 6.4 billion. Although down 18% year on year, its transaction volume still ranks the second.
Overseas Project Contracting 1: The value of newly signed contracts for overseas projects by Chinese enterprises reached USD 205.3 billion, up 6.5% year on year, of which the figure in the third quarter surged 26.5% year on year; the completed turnover reached USD 130.6 billion, up 6.7% year on year.
Chiu Chiu Mui, Global Head of Overseas Investment Business of EY China and EY Greater China Belt and Road Leader, said:
In the first three quarters of 2026, China's economy operated generally stably, registering a 4.6% year-on-year GDP growth 3, with the third quarter growth rate 0.2 percentage points higher than that of the second quarter; foreign trade posted strong growth, with the export of goods jumping 21.3% 4, and exports of smart green products such as integrated circuits, electric vehicles and lithium batteries led the growth. The overall outward foreign direct investment across all industries remained stable, with financial outward foreign direct investment up 52% year on year. However, affected by factors including rising interest rates and persistent geopolitical instability, the momentum of non-financial outward foreign direct investment (down 8.8% YoY) 5 and overseas M&A (down 14% YoY) 2 both weakened, and the pace of overseas investment slowed down.
At the policy level, the National Development and Reform Commission released the revised *Administrative Measures for Outward Investment* in October. The revised measures reiterate that domestic enterprises, other organizations and individual residents can all act as outward investment entities, improve systems such as reporting on major adverse situations and overseas reinvestment, and set up the annual outward investment information reporting system, so as to better protect the rights and interests of outward investment, prevent and respond to overseas risks, and draw a clearer compliance track for enterprises going global.
At the diplomatic level, the heads of state of China and the United States paid mutual visits within half a year for the first time in 11 years, which effectively stabilized global economic and trade expectations and provided strategic guidance for the healthy, stable and sustainable development of bilateral relations. The Shanghai Cooperation Organization Summit and the Meeting of the Council of Heads of Government (Prime Ministers) of SCO Member States were held successively, and China strengthened the alignment of development strategies and deepened cooperation with multiple member states. The deepening of the comprehensive strategic partnership between China and Egypt opens up space for two-way investment. It is worth noting that the 33rd APEC Economic Leaders' Meeting will be held in Shenzhen in November, which is expected to further deepen Asia-Pacific cooperation and major-country coordination, and inject stability into global development.
Please click the image to get the full report

Reshaping of the Global Economic Landscape
Divergence in Regional Growth Performance
01

Technological transformation and geopolitical risks are reshaping the global economic growth landscape. According to the forecast of the International Monetary Fund (IMF), the global economy will grow by 3.1% in 2026, down 0.4 percentage points from 2025. Growth momentum is being reallocated across different economies, and the divergence in growth performance of various countries mainly depends on their exposure to geopolitical conflicts and the supporting strength of AI-related demand for their growth. The overall advanced economies are expected to grow by 2.1%, among which Singapore (5%) and the Republic of Korea (3.3%) record relatively strong growth, the US growth rate (2.3%) is higher than the overall level, and the EU is expected to grow by 1.4%; the overall emerging economies are expected to grow by 3.7%, and countries including Vietnam (8.4%), India (7%), Indonesia (5.1%) and Egypt (5.1%) maintain a high growth rate; due to persistent geopolitical conflicts, the economies of most countries in the Middle East are expected to face contraction 6.
Against this backdrop, Chinese enterprises need to take AI development trends and geopolitical risk tolerance as important macro variables into their decision-making framework in the process of global layout. They should not only focus on potential shocks and compliance risks in the short term, but also focus on assessing the growth resilience, technology undertaking capacity and demand potential of target markets in the long term, dynamically track policy changes in key regions, improve emergency alternative plans, continuously enhance the resilience of global operation in complex environments, and accurately grasp structural opportunities.
Outward Foreign Direct Investment Across All Industries Remains Stable
While Non-financial Segment Records Four Consecutive Quarters of Year-on-Year Decline
02

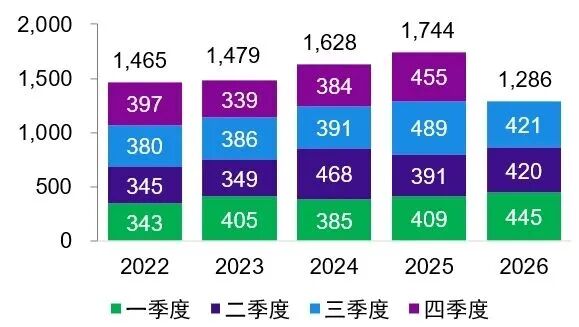
In the first three quarters of 2026, China's total outward foreign direct investment across all industries reached USD 128.6 billion, down 0.2% year on year. Among them, non-financial outward foreign direct investment reached USD 101.0 billion, down 8.8% year on year, marking four consecutive quarters of year-on-year decline; financial outward foreign direct investment reached USD 27.65 billion, up 52% year on year; non-financial direct investment in Belt and Road co-building countries reached USD 26.9 billion, down 10.4% year on year, accounting for 27% of the total.
Chart 1: China's Total Outward Foreign Direct Investment Across All Industries (USD 100 million)
Note: All data in the chart are rounded to integers. Due to rounding, the sum of individual values may have a minor rounding difference from the total value.
Source: Monthly concise statistical data of the Ministry of Commerce of China, EY analysis
Overseas M&A Becomes More Cautious
Both Transaction Value and Volume Decline
03

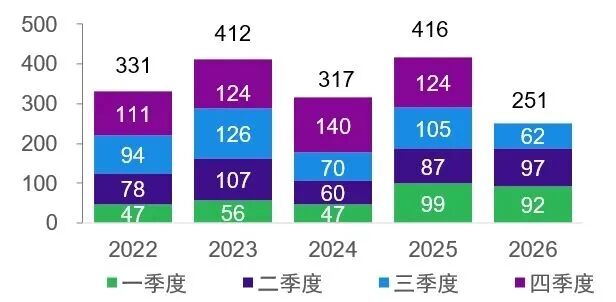
In the first three quarters of 2026, the total value of overseas M&A announced by Chinese enterprises reached USD 25.1 billion, down 14% year on year, and the M&A value in the third quarter dropped sharply by 36% quarter on quarter. The number of announced transactions by Chinese enterprises stood at 262, down 15% year on year, indicating further reduced transaction activity.
According to LSEG statistics, affected by factors including rising interest rates and persistent geopolitical instability, the transaction activity of the global M&A market also cooled down significantly in the third quarter (down 41% quarter on quarter).
Chart 2: Value of Overseas M&A Transactions Announced by Chinese Enterprises (USD 100 million)
Note: All data in the chart are rounded to integers. Due to rounding, the sum of individual values may have a minor rounding difference from the total value.
Source: LSEG, Mergermarket, data includes announced but not yet completed transactions, downloaded on October 8, 2026; EY analysis
Industry Analysis
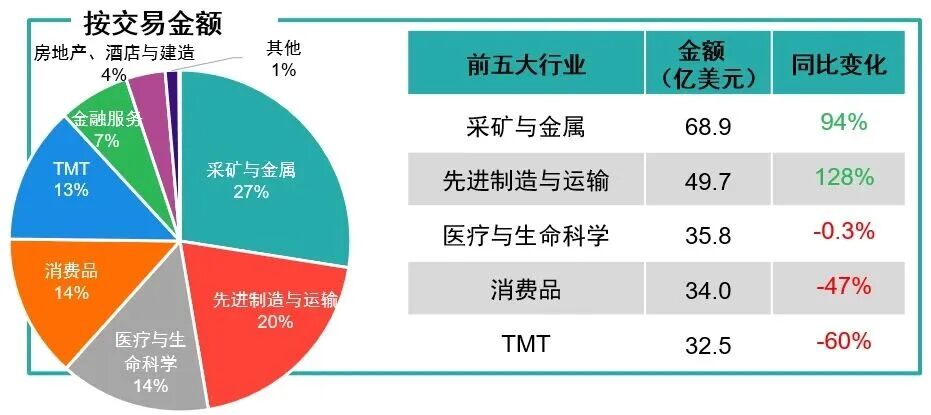
By M&A value: The mining and metals sector was the most popular sector in the first three quarters, with both M&A value and volume growing against the trend, among which the M&A value surged 94% year on year; the M&A activities mainly involve various mineral resources such as coal, silicone, aluminum, copper, lithium and gold, and Chinese enterprises continue to strengthen the layout of mineral resources. The M&A value of the advanced manufacturing and transportation sector reached USD 4.97 billion, up 128% year on year, mainly concentrated in fields such as industrial product manufacturing, transportation services and automotive industry chain, with multiple new transactions exceeding USD 100 million added in the third quarter.
By M&A volume: The advanced manufacturing and transportation sector and TMT* recorded more transactions. The advanced manufacturing and transportation sector registered 56 transactions in the first three quarters, ranking first and leading other sectors in transaction activity.
In addition, the M&A value and volume of the financial services sector increased by 76% and 13% respectively, making it one of the few sectors that achieved double growth amid the current sluggish market environment.
Chart 3: Popular Sectors of Overseas M&A Announced by Chinese Enterprises
*The TMT sector includes technology, media, entertainment and telecommunications industries
Note: All percentage data in the chart are rounded to integers. Due to rounding, the sum of individual values may have a minor rounding difference from 100%.
Source: LSEG, Mergermarket, data includes announced but not yet completed transactions, downloaded on October 8, 2026; EY analysis
Regional Analysis
Asia remains the largest destination for overseas M&A by Chinese enterprises in this period, with M&A value of USD 7 billion. However, due to the high base in the same period of 2025, the M&A value dropped 43% year on year, accounting for 28% of the total; by transaction volume, Asia continues to rank first, with 111 transactions, accounting for 42% of the total.
Oceania jumped to the second largest M&A destination due to two large-value transactions in the second quarter, with M&A value of USD 6.6 billion, surging 263% year on year, accounting for 26% of the total and hitting a nine-year high; however, the transaction volume is still at a relatively low level in the same period of history. Europe ranks the third largest M&A destination, with M&A value of USD 6.4 billion, down 18% year on year, accounting for 26% of the total; its transaction volume still ranks the second, accounting for 25% of the total. The M&A value of North America is USD 3.2 billion, accounting for 13% of the total; its transaction volume accounts for 16% of the total.
From the perspective of countries, by M&A value, Australia becomes the largest destination due to large-value transactions, followed by the United States and Germany; among the top 10 destinations, Australia, Norway, the Republic of Korea, the Philippines and Ukraine recorded growth; by transaction volume, Japan ranks first, and among the top 10 destinations, Japan, the Republic of Korea, Canada and Italy recorded growth.
Chart 4: Distribution of Overseas M&A Announced by Chinese Enterprises by Continent (Value and YoY %, Number of Transactions and YoY %)